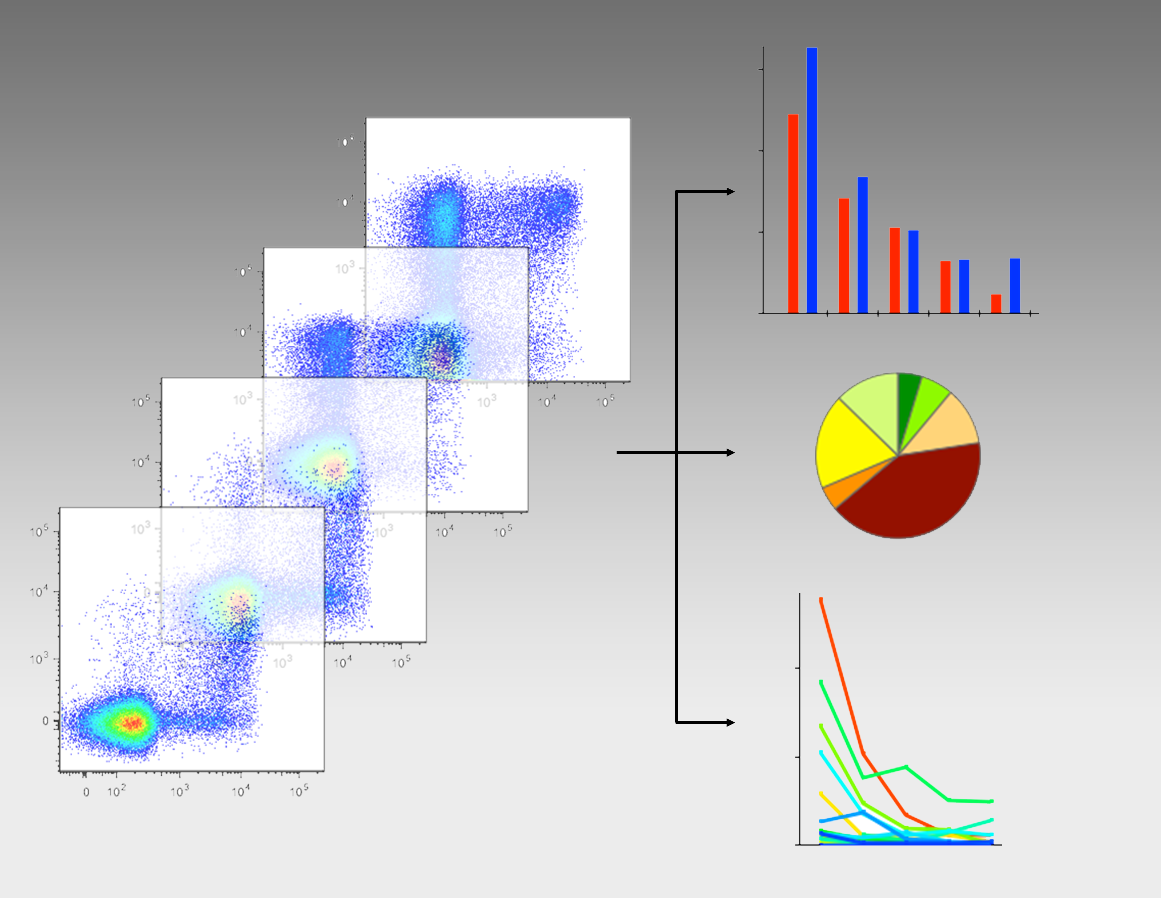
We use FlowJo for all assessments of fcs data files. Gating strategies are discussed in detail with the client prior to implementation and the rationale for any gating tree is thoroughly documented.
Where data analysis is required beyond the gating of specified populations and subsets, or comparison of dot plots in FlowJo, we use SPICE and Numbers for the exploration and visualization of data. More complex analyses can be discussed as necessary.
Customers will receive full reports for analyzed data, including graphs and data interpretation. We can help you to generate graphs for presentations, publications, and other documentation.

